Air Quality & Pollen forecasts
Official regional air quality measurements and pollen counts tracking integrated into Exovoid apps.
Air Quality Index (AQI)
We display AQI data measured by official stations in different countries to help users monitor environmental health factors. Generally, the five key pollutants tracked and displayed are:
- Ground-level ozone
- Particulate matter (PM2.5 particles)
- Particulate matter (PM10 particles)
- Carbon monoxide (CO)
- Sulfur dioxide (SO2)
- Nitrogen dioxide (NO2)
Official AQI Providers:
| Region | Source Name | Website |
|---|---|---|
| USA | U.S. Air Quality Index | www.airnow.gov |
| Europe | European Environment Agency | www.eea.europa.eu |
| Other regions | The World Air Quality Index Project | www.aqicn.org |
Pollen Forecasts
Our applications display detailed estimations on allergen concentrations, sourced directly from the analyses and forecasts of the **Copernicus Atmosphere Monitoring Service (CAMS)**.
CAMS forecasts are built using an ensemble of 11 state-of-the-art numerical air quality models developed across Europe, enabling highly accurate predictions for key allergen pollens:
- Alder pollen
- Grass pollen
- Olive pollen
- Birch pollen
- Mugwort pollen
- Ragweed pollen
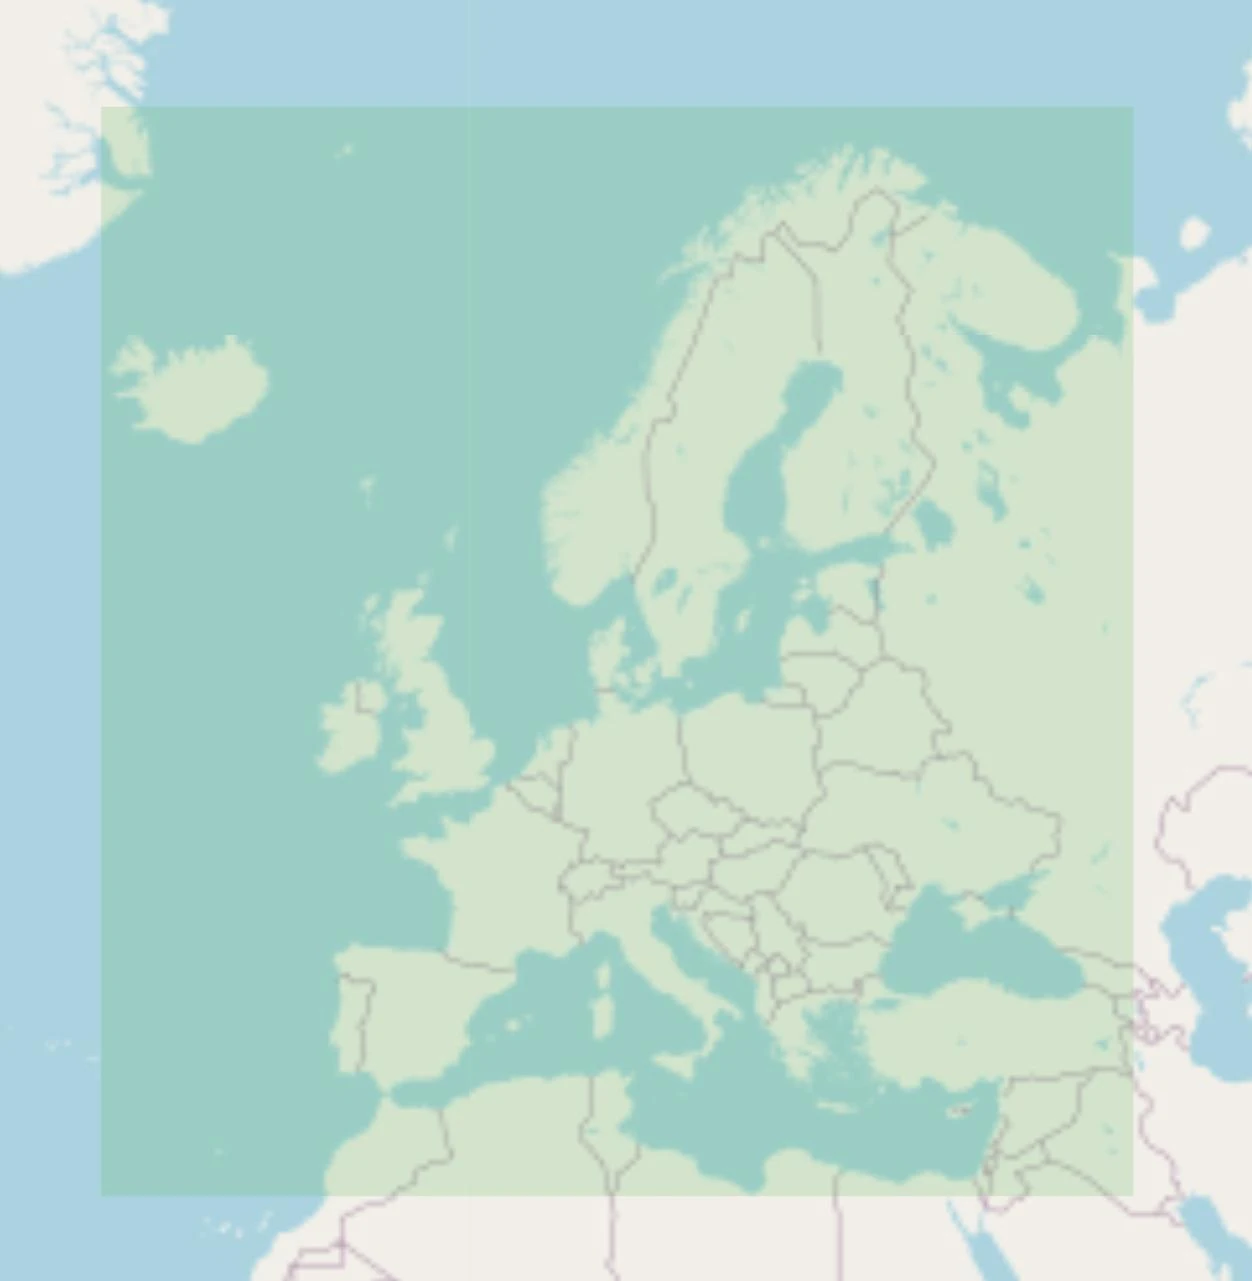
CAMS Pollen Forecast Coverage
Our apps track allergen density levels across the illustrated CAMS coverage zone. We continuously collaborate with meteorological and environmental partners to expand tracking zones for air quality metrics worldwide.